
In my recent IoT adventures I’ve been using Tasmota firmware to give me local only control over my devices. I’ve started to build out some sensors (temperature, flood) that I want to gather data from, this requires that I have a way to alert (and graph) the data coming out of these sensors. I already have Grafana + Prometheus running, thus it is just a matter of adding a prometheus exporter to get the data out.
Tasmota has built in MQTT support. While I could just craft my own prometheus exporter that scraped the data from the various devices, I decided that adding MQTT to the software stack and using an off the shelf MQTT prometheus exporter meant I was only managing configuration instead of writing something custom.
MQTT is a great protocol for IoT devices. It’s light weight and reliable, it’s dubbed “The Standard for IoT Messaging“. It didn’t take long for me to come across the Ecilpse Mosquitto project which based on the pull stats from dockerhub is very popular. The terms MQTT broker and MQTT server seem to be used interchangeably – the thing to remember is it’s a message queue system that supports publish / subscribe.
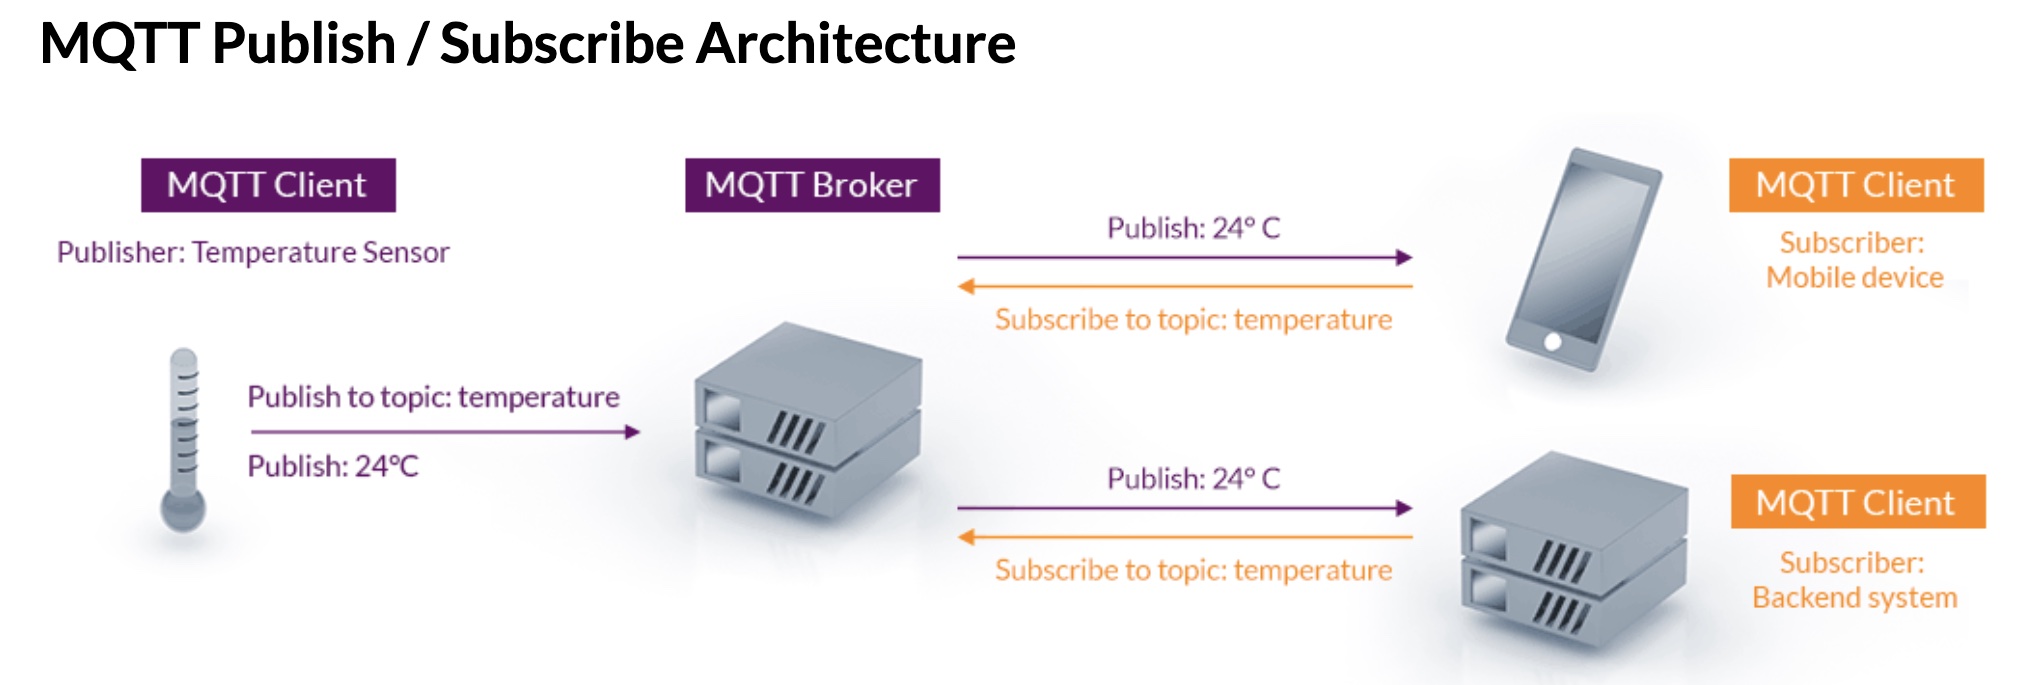 The Tasmota device is a client, Mosquitto is the broker, and the Prometheus exporter is a client. Once the data is in Prometheus I can make pretty graphs and create alerts in Grafana.
Running Mosquitto in a container was very easy, but quickly ran into a problem I had created myself with the restricted IoT network. Devices on my IoT network can’t see each other, or really much of anything including not being able to see the MQTT broker.
While I could poke a hole in the IoT network configuration to allow it to see the host:port that my MQTT broker is running on, there are a lot of containers running on that host/IP. Then I remember that I could use the docker macvlan support to create a unique IP address. [Security footnote: while this let’s me have a unique IP address, the code is still running on the same host as the other containers so the additional security is somewhat limited. This is still sort of cool and makes it less likely that I’ll goof up some firewall rules and expose too many things, it also sets me up for running an actual second host if I wanted better security.]
I quickly discovered that you can only have 1 macvlan setup on a host. It may be possible to work around this limitation using the 802.1q trunk bridge mode, this quickly started to seem complicated so I bailed. I did discover that with my existing macvlan network I can specify static IP addresses, and since I have unused IPs in my macvlan network this will work fine.
Here is the makefile that manages the docker deployment of my Mosquitto MQTT broker.
|
1 2 3 4 5 6 7 8 9 10 11 12 13 14 15 16 17 18 19 20 21 22 23 24 25 26 27 28 29 30 31 32 |
# Mosquitto - a MQTT broker / server # https://hub.docker.com/_/eclipse-mosquitto # NAME = mosquitto REPO = eclipse-mosquitto # ROOT_DIR:=$(shell dirname $(realpath $(lastword $(MAKEFILE_LIST)))) # Create the container build: docker create \ --name=$(NAME) \ -v $(ROOT_DIR)/mosquitto.conf:/mosquitto/config/mosquitto.conf \ -p 1883:1883 \ --network myMacvlanNet \ --ip 192.168.1.65 \ --restart=unless-stopped \ $(REPO) # # Start the container start: docker start $(NAME) # Update the container update: docker pull $(REPO) - docker rm $(NAME)-old docker rename $(NAME) $(NAME)-old make build docker stop $(NAME)-old make start |
And the mosquitto.conf file is simply
|
1 2 |
listener 1883 allow_anonymous true |
Keeping in mine that my wireguard container is running on 192.168.1.64 and I’ve gone back and modified the wireguard Makefile/container to specify that IP address to ensure that things work reliably after reboots.
The last thing I need to do is modify my OpenWRT configuration to allow the IoT network devices to be able to see this new container. Adding the following to my /etc/config/firewall enables that.
|
1 2 3 4 5 6 7 8 |
config rule option name 'Allow-MQTT-IoT' list proto 'tcp' option src 'iot' option dest 'lan' list dest_ip '192.168.1.65' option target 'ACCEPT' option dest_port '1883' |
Not specified here, but a good idea – is to assign a hostname to the static IP of the container so we can later reference it by name.
Configuring my Tasmota devices to talk with the MQTT broker is straightforward now that there is network visibility, the documentation is pretty easy to follow. Viewing the console of the Tasmota device helps see if the connection is successful.
|
1 2 3 4 |
19:53:03.050 MQT: Attempting connection... 19:53:03.072 MQT: Connected 19:53:03.076 MQT: device/sensor1/LWT = Online (retained) 19:53:03.078 MQT: device/sensor1/cmnd/POWER = |
Another good debugging technique is to shell into the mosquitto container and subscribe to all events.
|
1 2 |
$ docker exec -it mosquitto sh / # mosquitto_sub -t '#' -v |
A quick recap: We have statically assigned an IP to a container from the macvlan network. That container is running a MQTT broker. The IoT devices are sending events to that broker, and moving data from the IoT network onto the network where Prometheus lives.
Now all that is left is to add an exporter to pull data from MQTT and feed Prometheus. Looking at dockerhub it seems https://hub.docker.com/r/kpetrem/mqtt-exporter is very popular, but after some experiments it seemed it didn’t meet my needs. One thing I wanted to support was detecting when a device went missing and there wasn’t an easy way to do this using that exporter.
Using the list of prometheus ports it was easy to find many MQTT exporters. This one (https://github.com/hikhvar/mqtt2prometheus) stood out as a good option. While it doesn’t have a container on dockerhub, it does have one on the github hosted repo (ghcr.io/hikhvar/mqtt2prometheus:latest).
My Makefile for driving the container is
|
1 2 3 4 5 6 7 8 9 10 11 12 13 14 15 16 17 18 19 20 21 22 23 24 25 26 27 28 29 30 31 |
# # MQTT exporter # https://github.com/hikhvar/mqtt2prometheus # NAME = exporter-mqtt REPO = ghcr.io/hikhvar/mqtt2prometheus:latest # ROOT_DIR:=$(shell dirname $(realpath $(lastword $(MAKEFILE_LIST)))) # Create the container build: docker create \ --name=$(NAME) \ -v $(ROOT_DIR)/config.yaml:/config.yaml \ --network metrics-net \ --restart=unless-stopped \ $(REPO) # # Start the container start: docker start $(NAME) # Update the container update: docker pull $(REPO) - docker rm $(NAME)-old docker rename $(NAME) $(NAME)-old make build docker stop $(NAME)-old make start |
and more importantly the config file
|
1 2 3 4 5 6 7 8 9 10 11 12 13 14 15 16 17 18 19 20 21 22 23 24 25 26 27 28 29 30 31 32 33 34 35 36 37 38 39 40 41 |
mqtt: server: tcp://mqttbroker.local:1883 # Subscribe to all topics topic_path: "#" # Parse out the device id device_id_regex: ".*/(?P<deviceid>.*)/.*" # The MQTT QoS level qos: 0 # cache: # Each received metric will be presented for this time if no update is send via MQTT. timeout: 10m # json_parsing: separator: . # # Payloads # device/sensor1/SENSOR {"Time":"2022-03-02T17:11:43","Switch1":"ON","AM2301":{"Temperature":11.7,"Humidity":41.2,"DewPoint":-1.1},"TempUnit":"C"} # device/sensor1/RESULT {"POWER":"OFF"} # # Only metrics listed here will be exported metrics: - prom_name: mqtt_temperature mqtt_name: AM2301.Temperature help: DHT22 temperature reading type: gauge - prom_name: mqtt_humidity mqtt_name: AM2301.Humidity help: DHT22 humidity reading type: gauge - prom_name: mqtt_power mqtt_name: POWER help: Water sensor type: gauge # Map "ON" and "OFF" to integer values string_value_mapping: map: ON: 1 OFF: 0 |
Most interesting for others here is probably the MQTT payloads and the mapping I’ve made to the config file. It took a few iterations to figure out the correct config file based on the documentation.
Now that I’ve got data flowing, I can create pretty graphs and set alerts as needed.

I’ve also achieved a no-code solution to getting data from the Tasmota IoT sensors into graphs and alerts. The pathway is a little longer than I would like for reliability: IoT device -> MQTT Broker -> exporter -> Prometheus -> Grafana. This means that I need 4 containers to work + the IoT device itself. It’s still not a bad solution, and the Prometheus + Grafana solution is used for monitoring other components of my infrastructure so I pay regular attention to it.