 Like many parents, my kids have hand me down phones. This is generally a great way to extend the life of a device, and teenagers can be tough on phones. Some more than others.
My oldest has been one of those kids who has been generally gentle with technology, and the devices tend to last. I’ve replaced a few tempered glass screen protectors but those are disposable. I have to admit that I didn’t take the signs of problems seriously when the screen on the Google Pixel 1 started to go black occasionally – a hard reboot often fixed things up. This was just some mysterious software issue I thought.
Nope. It was the early signs of the screen going bad. One day, the screen just stayed black no matter what I did. Did we have a recent backup? Nope, it was many months old. That’s also on me. At the first sign of any weirdness with a mobile device, checking the current backup status should be a high priority.
This device was running LineageOS, and unfortunately the default security is pretty good. Oh, I tried lots of things. Blindly, boot device into fastboot mode. Load a recovery via fastboot – connect to that via adb.. but just not enough magic to get through decrypting the filesystem via recovery without access to the screen. This was back in 2020. I would try from time to time to figure out a way to recover a screen-less Android phone running LineageOS, but it continued to resist my attempts.
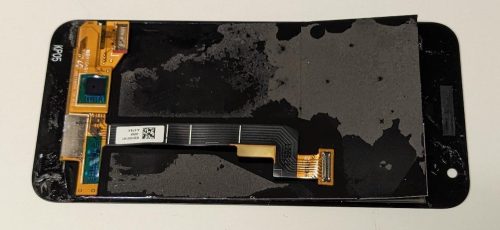
The picture at the top of the post is the very busted screen from the Pixel 1. At one point in my recovery attempts I thought – maybe it’s simply that the ribbon cable needs to be re-seated? Despite being careful, I can safely report that removing the screen is very hard and you’re likely to break it. I pretty much destroyed that screen.
I had reached out to a local repair shop, but they only were interested in selling me a complete screen replacement – not helping me hook up a screen and recover the data. I continued to look for economical screen replacement options, but at this point I didn’t even know if the screen was the problem.
Just the other day, I found a pair of used Pixel1 screens for $30 + $10 shipping. This was cheap enough that it was worth the risk. I got lucky, the used screen was exactly what I needed.
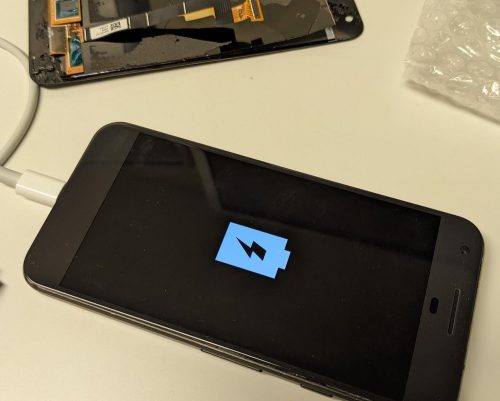
 Cool. There is hope. The phone battery was very dead, so it wasn’t allowing me to power it on. My initial attempts to power on were also scary, I kept getting “no OS found, corrupted data”. I was able to boot to the fastboot screen, but not able to start the recovery image (if there even is one?).
After a few minutes of charging, and more attempts to boot – it started to load!
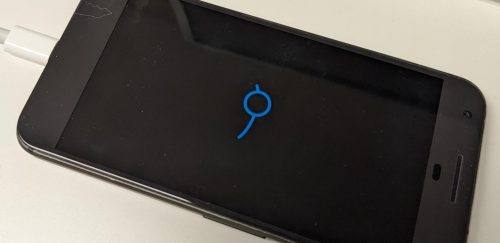
 I was so happy to see the LineageOS boot screen. Now I was crossing my fingers hoping I’d get a full boot without problems. This next image increased my joy.
 The touch screen worked fine, and I was able to log in. I was so close to being able to recover the files from this phone, but I had to let it charge up.
Once it was charged, unlocking the phone and connecting a laptop to it was trivial. I was able to pull down the 900+ photos and push them up to my fileserver for safe keeping. In the end it took a couple of years to recover, but I’m glad I kept at it. I also was very lucky that it was only the screen.
Go backup your data. Better yet, invest the time to create a regular backup system. Test your backups.
