It was no surprise that a new RAIDZ array built out of decade old drives was going to have problems, I didn’t expect the problems to happen quite so quickly, but I was not surprised. This drive had 4534 days of power on time, basically 12.5 years. It was also manufactured in Oct 2009, making it 14.5 years old.
I had started to backup some data to this new ZFS volume, and upon one of the first scrub operations ZFS flagged this drive as having problems.
1 2 3 4 5 6 7 8 9 10 11 12 13 14 15 16 17 18 19 20 |
$ zpool status pool: backup state: DEGRADED status: One or more devices are faulted in response to persistent errors. Sufficient replicas exist for the pool to continue functioning in a degraded state. action: Replace the faulted device, or use 'zpool clear' to mark the device repaired. scan: scrub repaired 908K in 13:29:51 with 0 errors on Tue Apr 9 06:59:00 2024 config: NAME STATE READ WRITE CKSUM backup DEGRADED 0 0 0 raidz1-0 DEGRADED 0 0 0 ata-WDC_WD10EARX-00N0YB0_WD-WMC0T0683946 ONLINE 0 0 0 wwn-0x50014ee2b0706857 ONLINE 0 0 0 wwn-0x50014ee2adfa14f6 ONLINE 0 0 0 wwn-0x50014ee2ae38ab42 FAULTED 36 0 0 too many errors errors: No known data errors |
The degraded device, maps to /dev/sdg – I determined this by looking a the /dev/disk/by-id/wwn-0x50014ee2ae38ab42 link.
On one of my other systems I’m using snapraid.it, which I quite like. It has a SMART check that does a calculation to indicate how likely the drive is to fail. I’ve often wondered how accurate this calculation is.
|
|
SnapRAID SMART report: Temp Power Error FP Size C OnDays Count TB Serial Device Disk ----------------------------------------------------------------------- 28 4534 0 100% 1.0 WD-WCAV53163713 /dev/sdg - 24 3803 0 84% 1.0 WD-WMC0T0683946 /dev/sdd - 23 4156 0 84% 1.0 WD-WCAZA6813339 /dev/sde - 27 4740 0 97% 1.0 WD-WCAV51778566 /dev/sdf - The FP column is the estimated probability (in percentage) that the disk is going to fail in the next year. Probability that at least one disk is going to fail in the next year is 100%. |
The nice thing is you don’t need to be using snapraid to get the SMART check data out, it’s a read only activity based on the devices. In this case it has decided the failing drive has 100% chance of failure, so that seems to check out.
Well, as it happens I had a spare 1TB drive on my desk so it was a matter of swapping some hardware. I found a very useful blog post covering how to do it, and will replicate some of the content here.
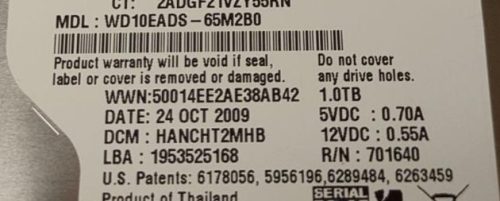
As I mentioned above, you first need to figure out which device it is, in this case it is /dev/sdg. I also want to figure out the serial number.
|
|
$ sudo smartctl -a /dev/sdg | grep Serial Serial Number: WD-WCAV53163713 |
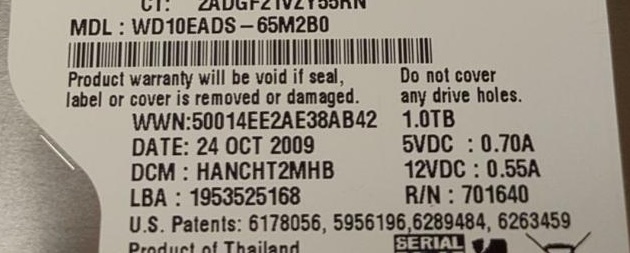
Good, so we know the serial number (and the brand of drive), but when you’ve got 4 identical drives, which of the 4 is the right serial number? Of course, I ended up pulling all 4 drives before I found the matching serial number. The blog post gave some very good advice.
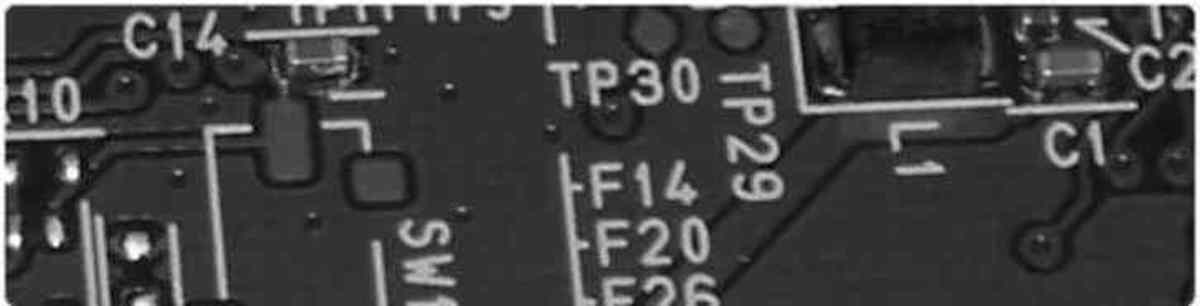
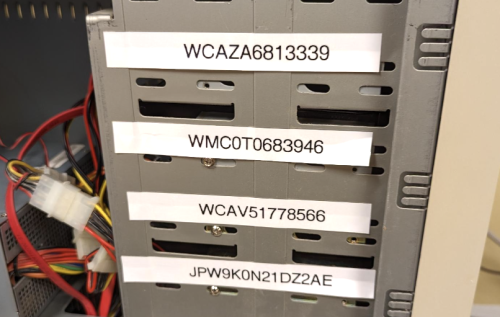
Before I configure an array, I like to make sure all drive bays are labelled with the corresponding drive’s serial number, that makes this process much easier!
Every install I make will now follow this advice, at least for ones with many drives. My system now looks like this thanks to my label maker
 I’m certain future me will be thankful.
Because the ZFS array had marked this disk as being in a FALTED state, we do not need to mark it ‘offline’ or anything else before pulling the drive. If we were swapping an ‘online’ disk we may need to do more before pulling the drive.
Now that we’ve done the physical swap, we need to get the new disk added to the pool.
The first, very scary thing we need to do is copy the partition from an existing drive in the vdev. The new disk is the TARGET, and an existing disk is SOURCE.
|
|
# Check twice, you really don't want to mess this up # sudo sgdisk --replicate /dev/TARGET /dev/SOURCE $ sudo sgdisk --replicate /dev/sdg /dev/sdf |
Once the partition is copied over, we want to randomize the GUIDs as I believe ZFS relies on unique GUIDs for devices.
|
|
# Again, taking care that the device is the TARGET (aka: new drive) $ sudo sgdisk --randomize-guids /dev/sdg |
This is where my steps deviate from the referenced blog post, but the changes make complete sense. When I created this ZFS RAIDZ array I used the short sdg name for the device. However, as you can see after a reboot the zpool command is showing me the /dev/disk/by-id/ name.
|
|
# sudo zpool replace backup OLD NEW $ sudo zpool replace backup /dev/disk/by-id/wwn-0x50014ee2ae38ab42 /dev/sdg |
This worked fine. I actually had a few miss-steps trying to do this, and zpool gave me very friendly and helpful error messages. More reason to like ZFS as a filesystem.
1 2 3 4 5 6 7 8 9 10 11 12 13 14 15 16 17 18 19 20 |
$ zpool status backup -v pool: backup state: DEGRADED status: One or more devices is currently being resilvered. The pool will continue to function, possibly in a degraded state. action: Wait for the resilver to complete. scan: resilver in progress since Thu Apr 11 09:12:10 2024 18.6G / 2.15T scanned at 359M/s, 0B / 2.15T issued 0B resilvered, 0.00% done, no estimated completion time config: NAME STATE READ WRITE CKSUM backup DEGRADED 0 0 0 raidz1-0 DEGRADED 0 0 0 ata-WDC_WD10EARX-00N0YB0_WD-WMC0T0683946 ONLINE 0 0 0 wwn-0x50014ee2b0706857 ONLINE 0 0 0 wwn-0x50014ee2adfa14f6 ONLINE 0 0 0 replacing-3 DEGRADED 0 0 0 wwn-0x50014ee2ae38ab42 OFFLINE 0 0 0 sdg ONLINE 0 0 0 |
Cool, we can see that ZFS is repairing things with the newly added drive. Interestingly it is shown as sdg currently.
This machine is pretty loud (it has a lot of old fans), so I was pretty wild and powered it down while the ZFS was trying to resilver things. When I rebooted it after relocating it to where it normally lives and the noise won’t bug me, it seems that the device naming has sorted itself out.
1 2 3 4 5 6 7 8 9 10 11 12 13 14 15 16 17 18 19 20 |
$ zpool status backup -v pool: backup state: DEGRADED status: One or more devices is currently being resilvered. The pool will continue to function, possibly in a degraded state. action: Wait for the resilver to complete. scan: resilver in progress since Thu Apr 11 09:12:10 2024 22.9G / 2.15T scanned at 244M/s, 0B / 2.15T issued 0B resilvered, 0.00% done, no estimated completion time config: NAME STATE READ WRITE CKSUM backup DEGRADED 0 0 0 raidz1-0 DEGRADED 0 0 0 ata-WDC_WD10EARX-00N0YB0_WD-WMC0T0683946 ONLINE 0 0 0 wwn-0x50014ee2b0706857 ONLINE 0 0 0 wwn-0x50014ee2adfa14f6 ONLINE 0 0 0 replacing-3 DEGRADED 0 0 20 wwn-0x50014ee2ae38ab42 OFFLINE 0 0 0 wwn-0x5000cca3a8d3fcdb ONLINE 0 0 0 |
The snapraid SMART report now looks a lot better too
|
|
$ sudo snapraid smart [sudo] password for roo: SnapRAID SMART report: Temp Power Error FP Size C OnDays Count TB Serial Device Disk ----------------------------------------------------------------------- 26 1416 0 4% 1.0 JPW9K0N21DZ2AE /dev/sdg - 23 4158 0 84% 1.0 WD-WCAZA6813339 /dev/sdd - 23 3805 0 84% 1.0 WD-WMC0T0683946 /dev/sde - 25 4742 0 97% 1.0 WD-WCAV51778566 /dev/sdf - |
It took about 9 hours to finish the resilvering, but then things were happy.
|
|
$ zpool status backup -v pool: backup state: ONLINE scan: resilvered 531G in 09:17:03 with 0 errors on Thu Apr 11 18:29:13 2024 config: NAME STATE READ WRITE CKSUM backup ONLINE 0 0 0 raidz1-0 ONLINE 0 0 0 ata-WDC_WD10EARX-00N0YB0_WD-WMC0T0683946 ONLINE 0 0 0 wwn-0x50014ee2b0706857 ONLINE 0 0 0 wwn-0x50014ee2adfa14f6 ONLINE 0 0 0 wwn-0x5000cca3a8d3fcdb ONLINE 0 0 0 errors: No known data errors |
Some folks think that you should not use RAIDZ, but create a pool with a collection of vdevs which are mirrors.
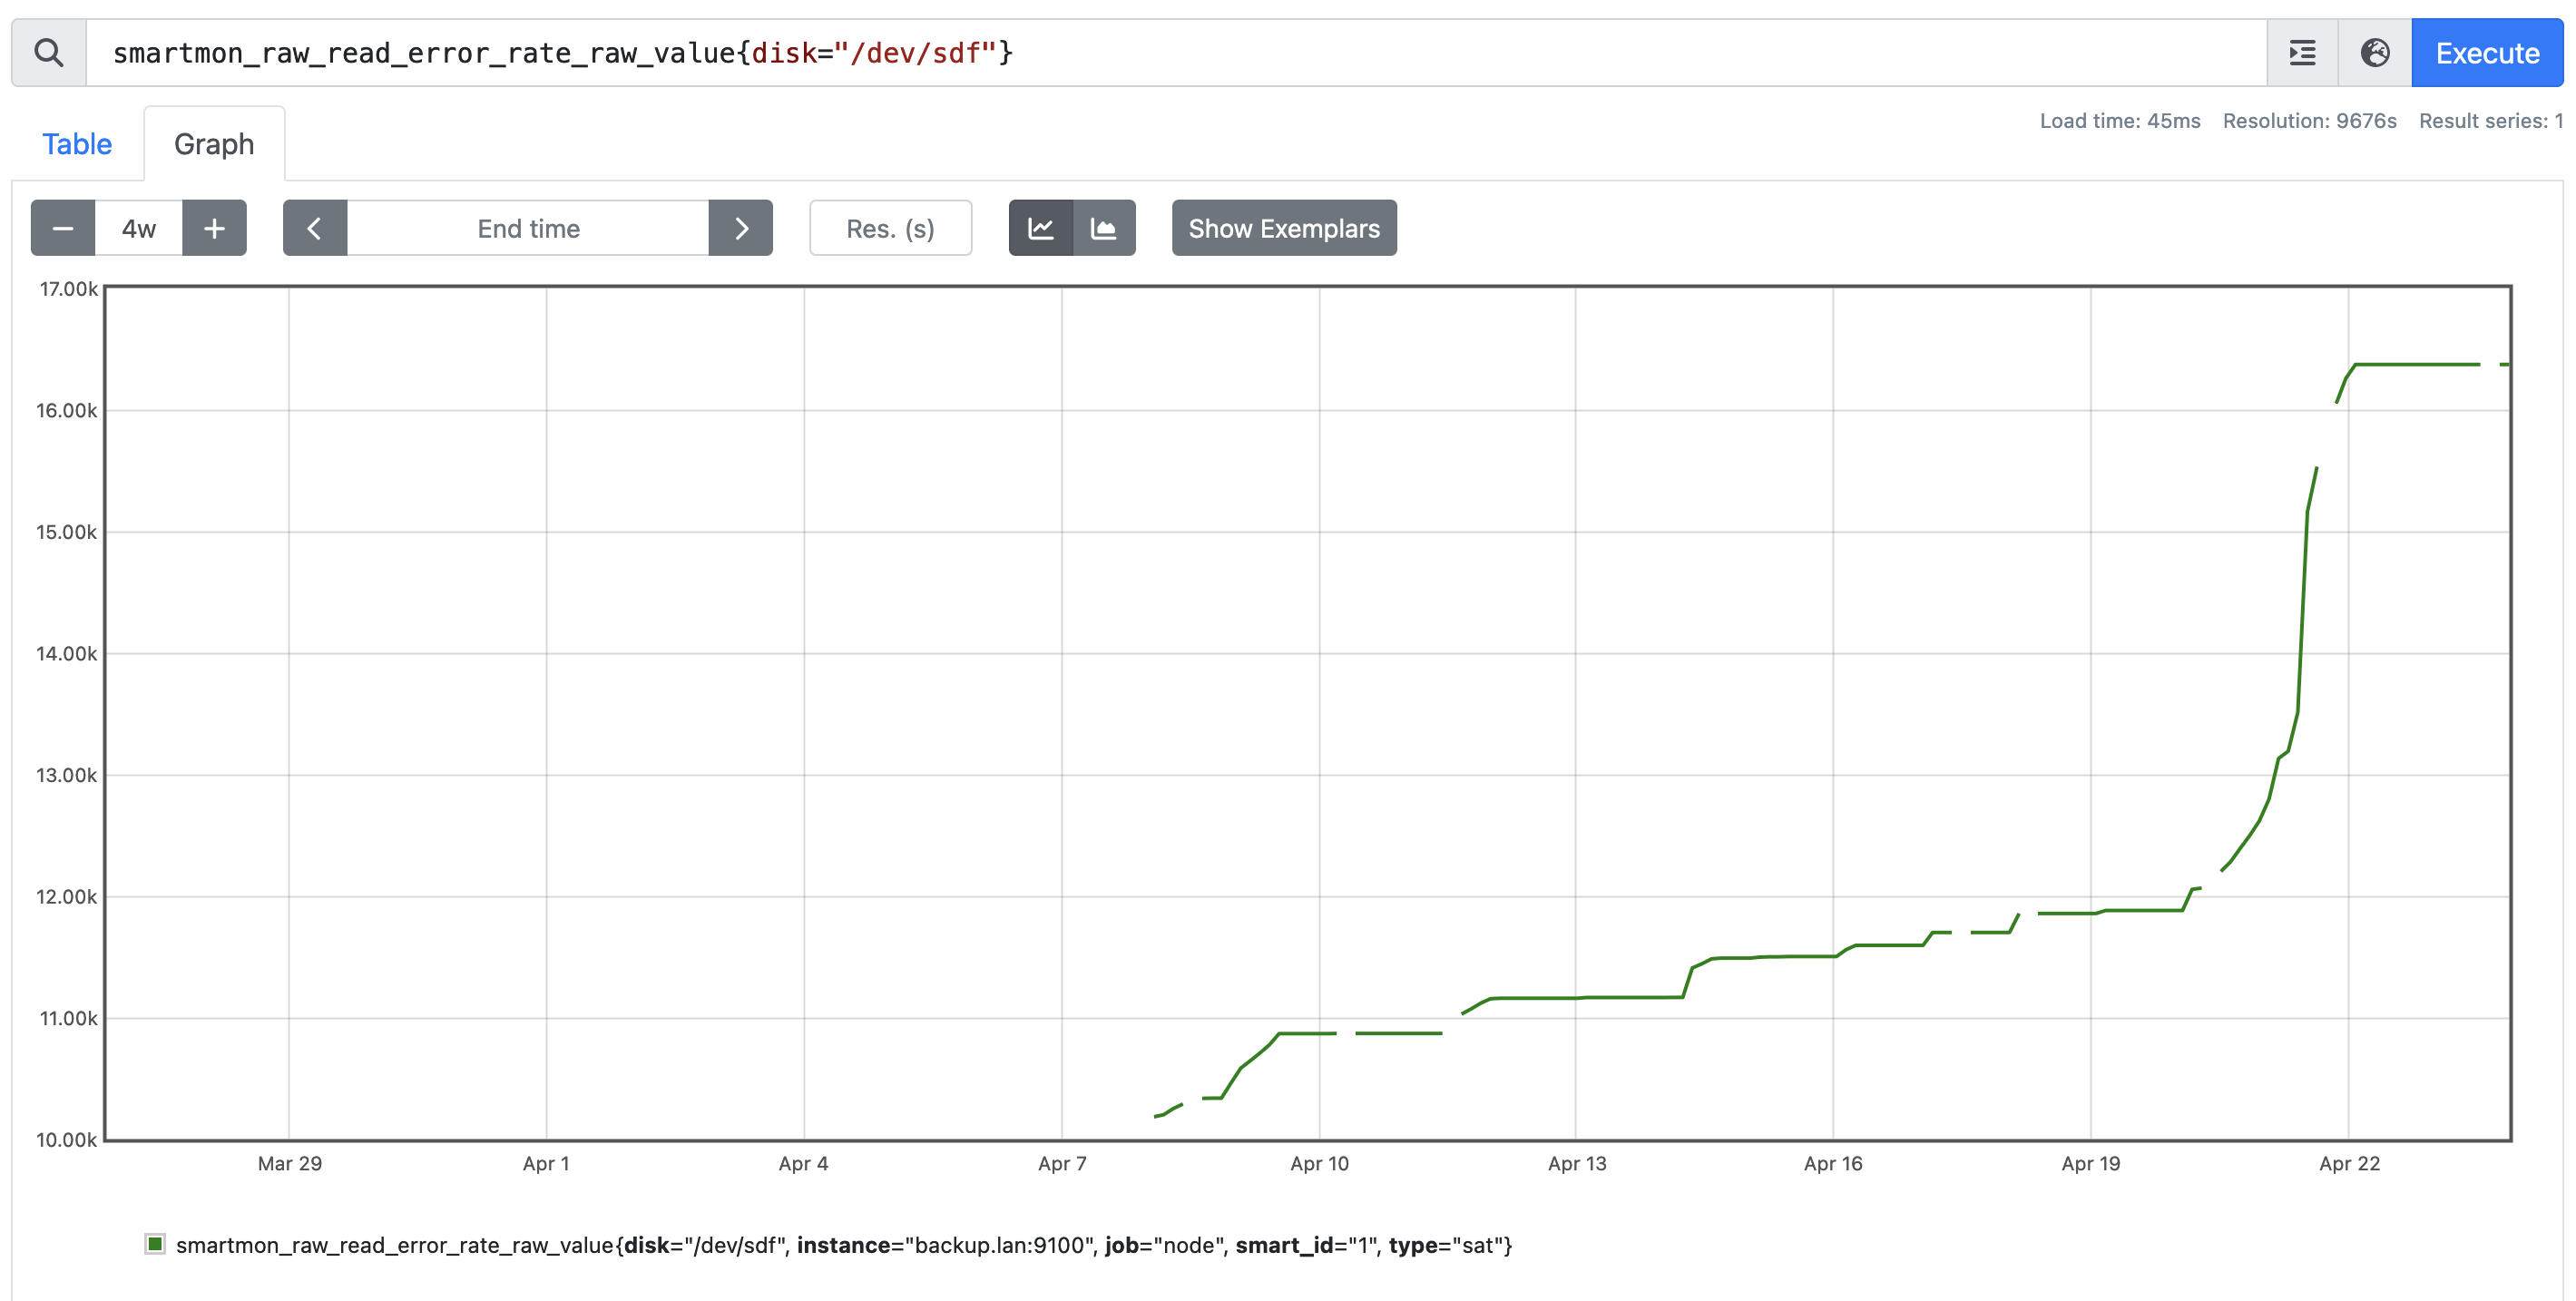
About 2 weeks later, I had a second disk go bad on me. Again, no surprise since these are very old devices. Here is a graph of the errors.
 The zfs scrub ran on April 21st, and you can see the spike in errors – but clearly this drive was failing slowly all along as I was using it in this new build. This second failing drive was
 /dev/sdf – which if you look back at the snapraid SMART report, was at 97% failure percentage. It is worth noting that while ZFS and the snapraid SMART have both decided these drives are bad, I was able to put both drives into a USB enclosure and access them still – I certainly don’t trust these old drives to store data on them, but ZFS stopped using the device before it became unusable.
I managed to grab a used 1TB drive for $10. It is quite old (from 2012) but only has a 1.5yrs of power on time. Hopefully it’ll last, but at the price it’s hard to argue. Swapping that drive in was a matter of following the same steps. Having the drive bay labelled with the serial numbers was very helpful.
Since then, I’ve picked up another $10 1TB drive, and this one is from 2017 with only 70 days of power on time. Given I’ve still got two decade old drives in this RAIDZ, I suspect I’ll be replacing one of them soon. The going used rate for 1TB drives is between $10 and $20 locally, amazing value if you have a redundant layout.